Stephen Martin, Ph.D.
Knowing the total number of people using a trail is important for planning purposes and for seeking funding to support or extend the trail. Automatic trail counters can tell us the number of people or bicycles passing the counters in a given time period; however, they cannot tell us the total trail usage without additional calculations. At first glance, calculating the number of users from the counter data would seem to be an impossible task. This is because some people will not pass any counter, while others may pass several counters and be counted multiple times.
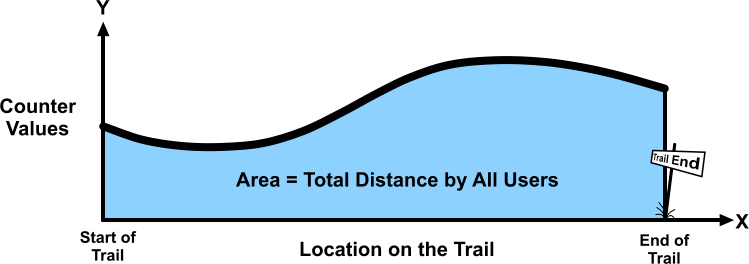
The “trick” to solving this is recognizing that if one knew the traffic count at every point on the trail, and made a line plot of counts vs. position on the trail (see above), the area under the curve is equal to the total distance travelled by all user of the trail (in the given time period). But since we only know the count at a few points on the trail, we can obtain an approximate area (and therefore an approximate total distance travelled) using well-known mathematical methods. After calculating the total distance travelled, the number of users is calculated by simply dividing the total distance by the average distance travelled per user. This average distance per user can be obtained from surveys of trail users.
This method was developed in support of a successful campaign by Friends of The Legacy Trail to extend The Legacy Trail eight miles north to downtown Sarasota. It is currently used by the Sarasota County Parks, Recreation and Natural Resources Department to report monthly usage of the trail. The monthly usage data for the last several years can be viewed here.
For more information, read on …
(If you are viewing this from a phone, click the link below to download the full document. Thanks!)
The Following is a Claude AI Summary of the Method
This is a really elegant piece of work by Dr. Stephen Martin. Here’s a summary of the method:
The Core Idea: The method is built around a simple equation: Number of Users = Area under the counter curve ÷ Average distance traveled per user. The key insight is that the area under the counter curve equals the total distance traveled by all users combined, so dividing by the average trip distance gives you the number of users.
The Counter Curve: If you plot each counter’s location on the X-axis and its count on the Y-axis, you get a set of points. Connecting those points gives you the “counter curve,” and the area under it represents total distance traveled by all users.
Three Methods for Estimating the Area, depending on how many counters you have:
- One counter (Midpoint Method): Place the counter at the center of the trail. Area ≈ trail length × count. Works well even if the curve is sloped because errors on each side cancel out.
- Two counters (Gaussian Quadrature): Place counters at about 21% from each end of the trail. Area = trail length × average of the two counts. Surprisingly accurate.
- Multiple counters at arbitrary locations (Trapezoidal Method): Connect the counter points with straight lines, divide the area into trapezoids, and sum them up using weighted formulas.
What You Still Need The one input the counters can’t tell you is the average distance users travel per trip (μ). That requires a separate user survey asking people how far they actually traveled on the trail.
It’s a genuinely clever approach — especially the insight that you no longer need to know what fraction of users do a round trip versus one-way, since the math handles arbitrary user behavior automatically.